Users Love Deals. They Don't Love Us.
The Smarter Discount — Winning Back Users with AI-Powered Personalized Promotions
Role
UX Researcher
Skills
Survey Design, A/B Testing, Statistical Analysis (Chi-Square, Welch's t-test)
Timeline
4 Weeks, Survey — A/B Test Analysis
Context
Simulated client engagement (bootcamp)
Overview
This was a simulated engagement. The client, data, and constraints were provided by the program.
Cravee is a food delivery platform with strong acquisition but persistent retention problems. We ran a 350-person survey to diagnose loyalty and churn drivers. We then designed an A/B test comparing AI-personalized promotions against random ones. The effect grew stronger over three months, suggesting the change held rather than fading after the promo.
Personalized promotions increased monthly retention by 21–35% and boosted order frequency by 45%.
Users Love Deals. They Don't Love Us.
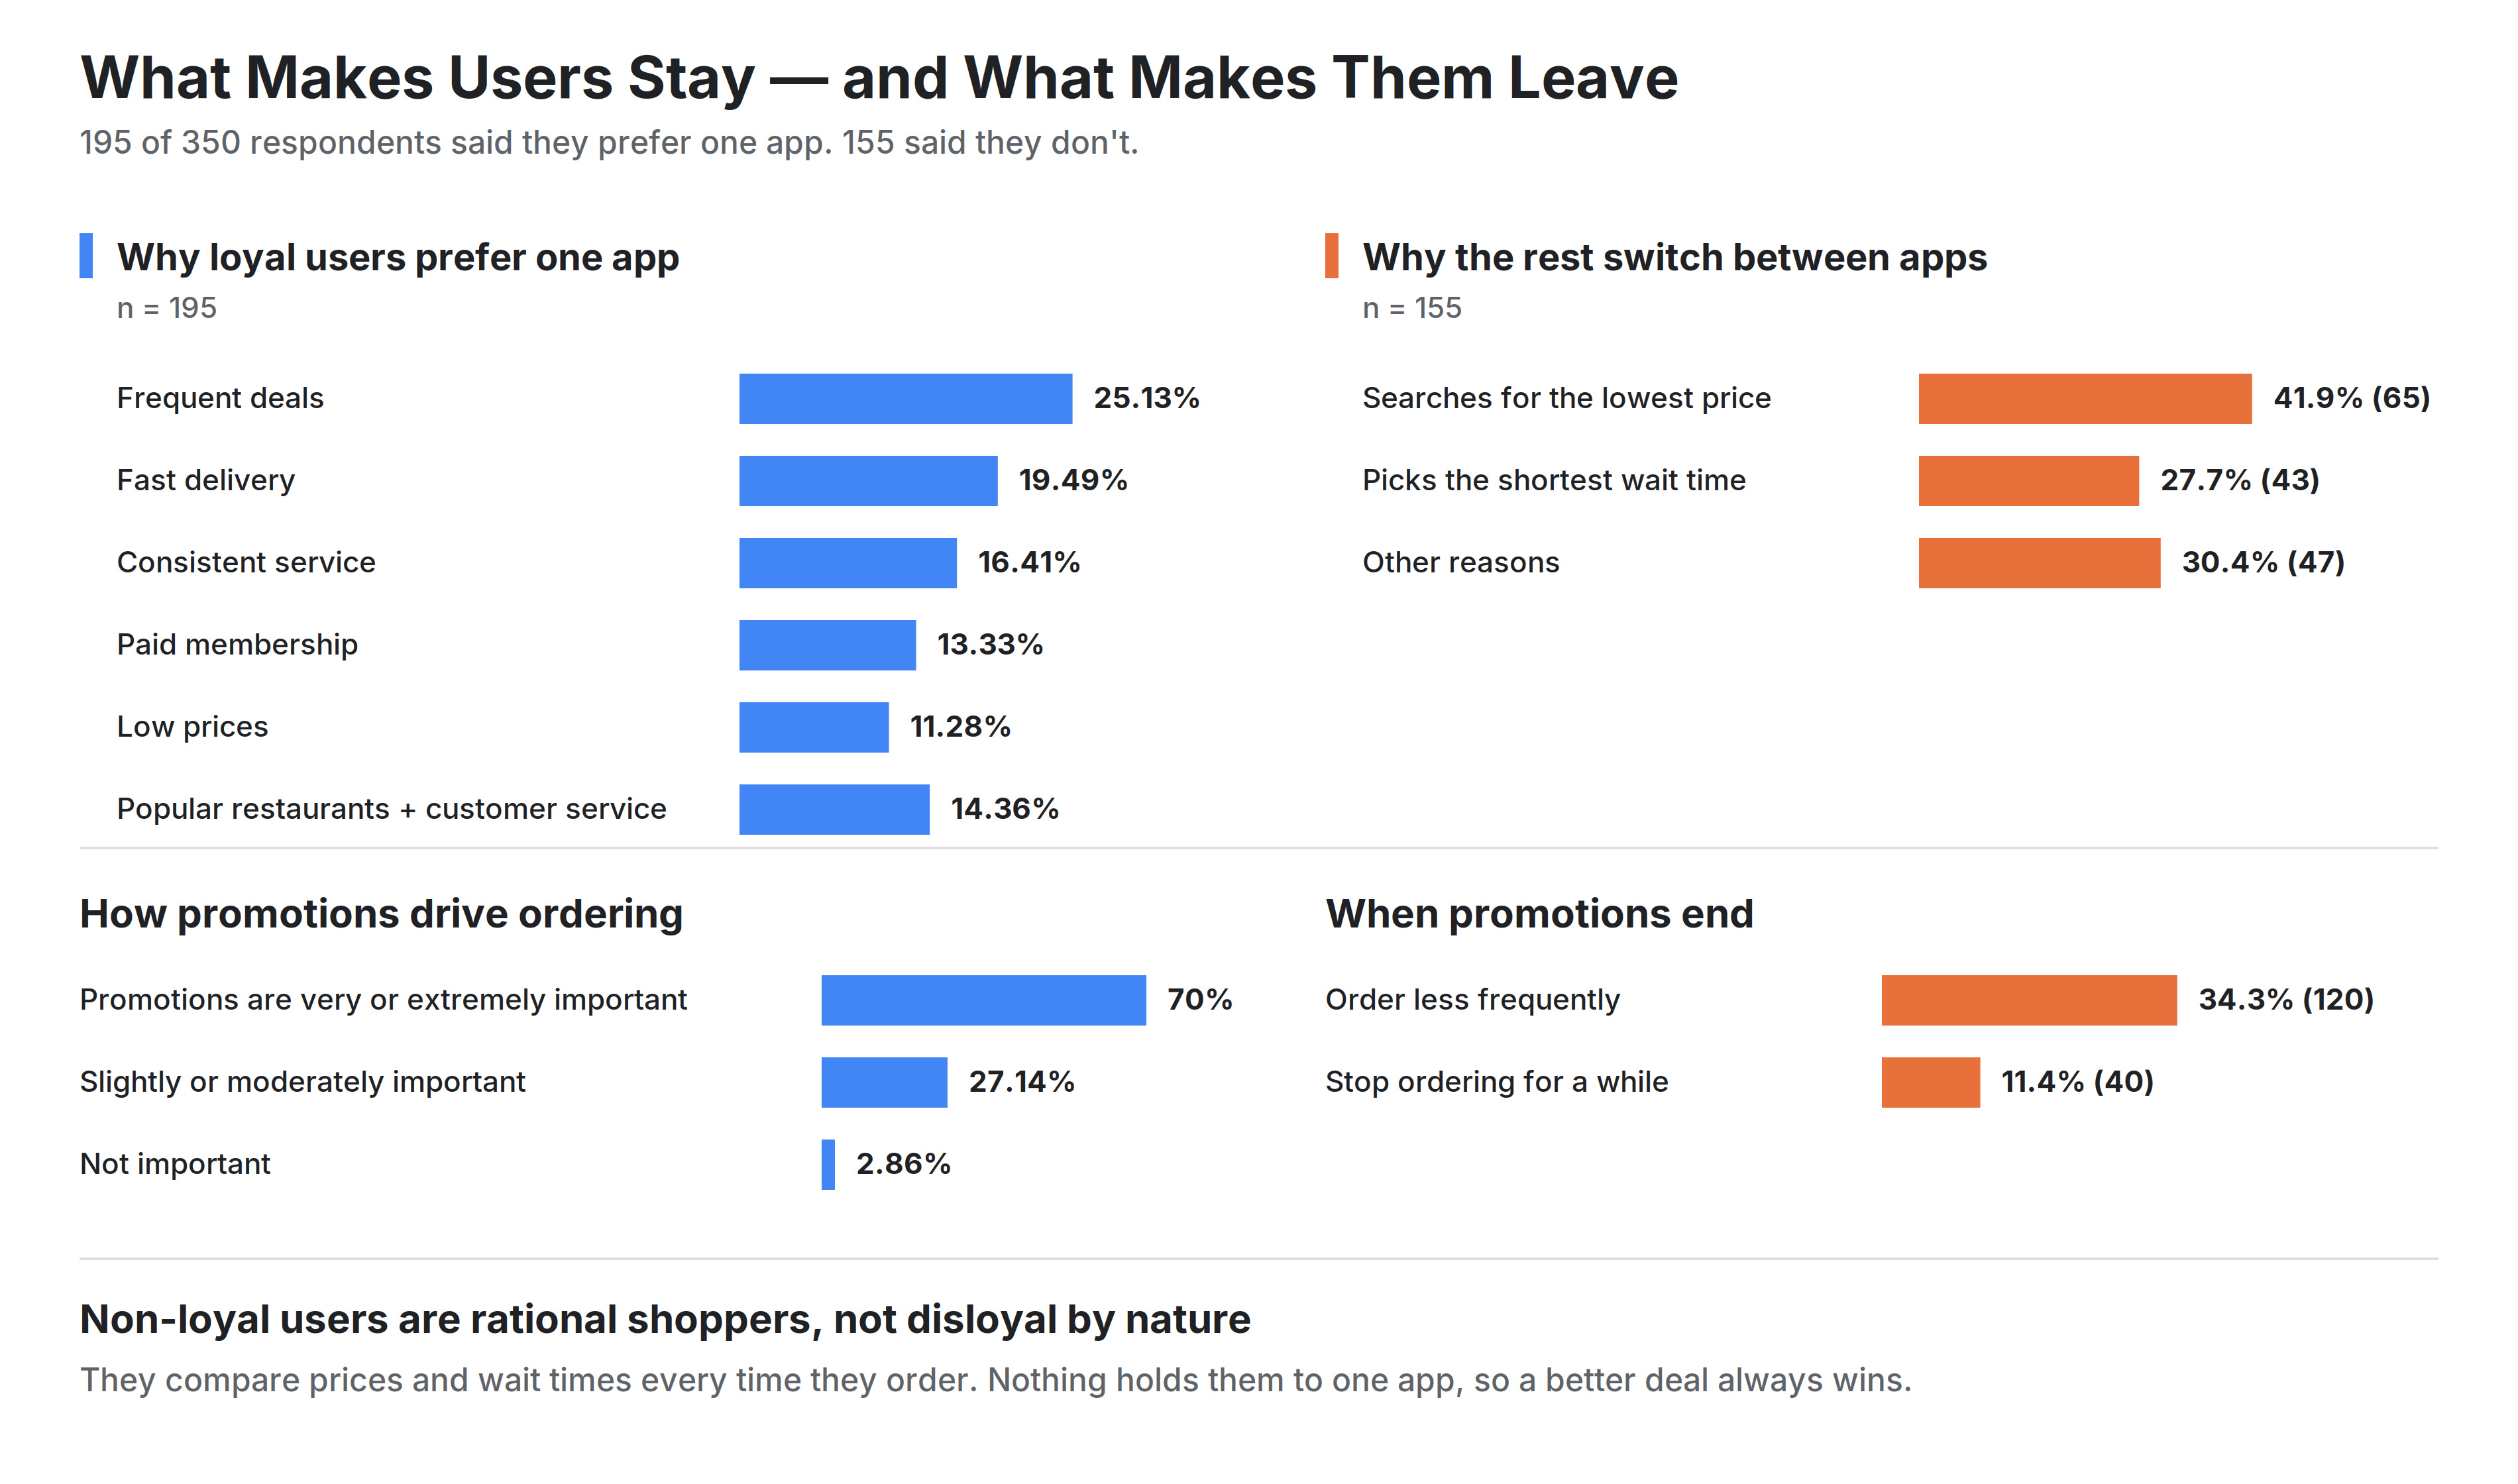
Despite high ordering frequency, users were switching between apps for better deals, leaving after promotional periods ended, and expressing dissatisfaction with delivery times and food quality.
83%
Serial comparison shoppers
Actively compare multiple delivery apps before placing an order.
70%
Deals are existential
Say deals are very or extremely important. Reducing promotions directly triggers churn.
37%
Top loyalty driver: pricing
Deals and pricing emerged as the top retention lever.
36%
Second driver: reliability
Speed and reliability are equally powerful for retention.
Phase 1: Customer Survey
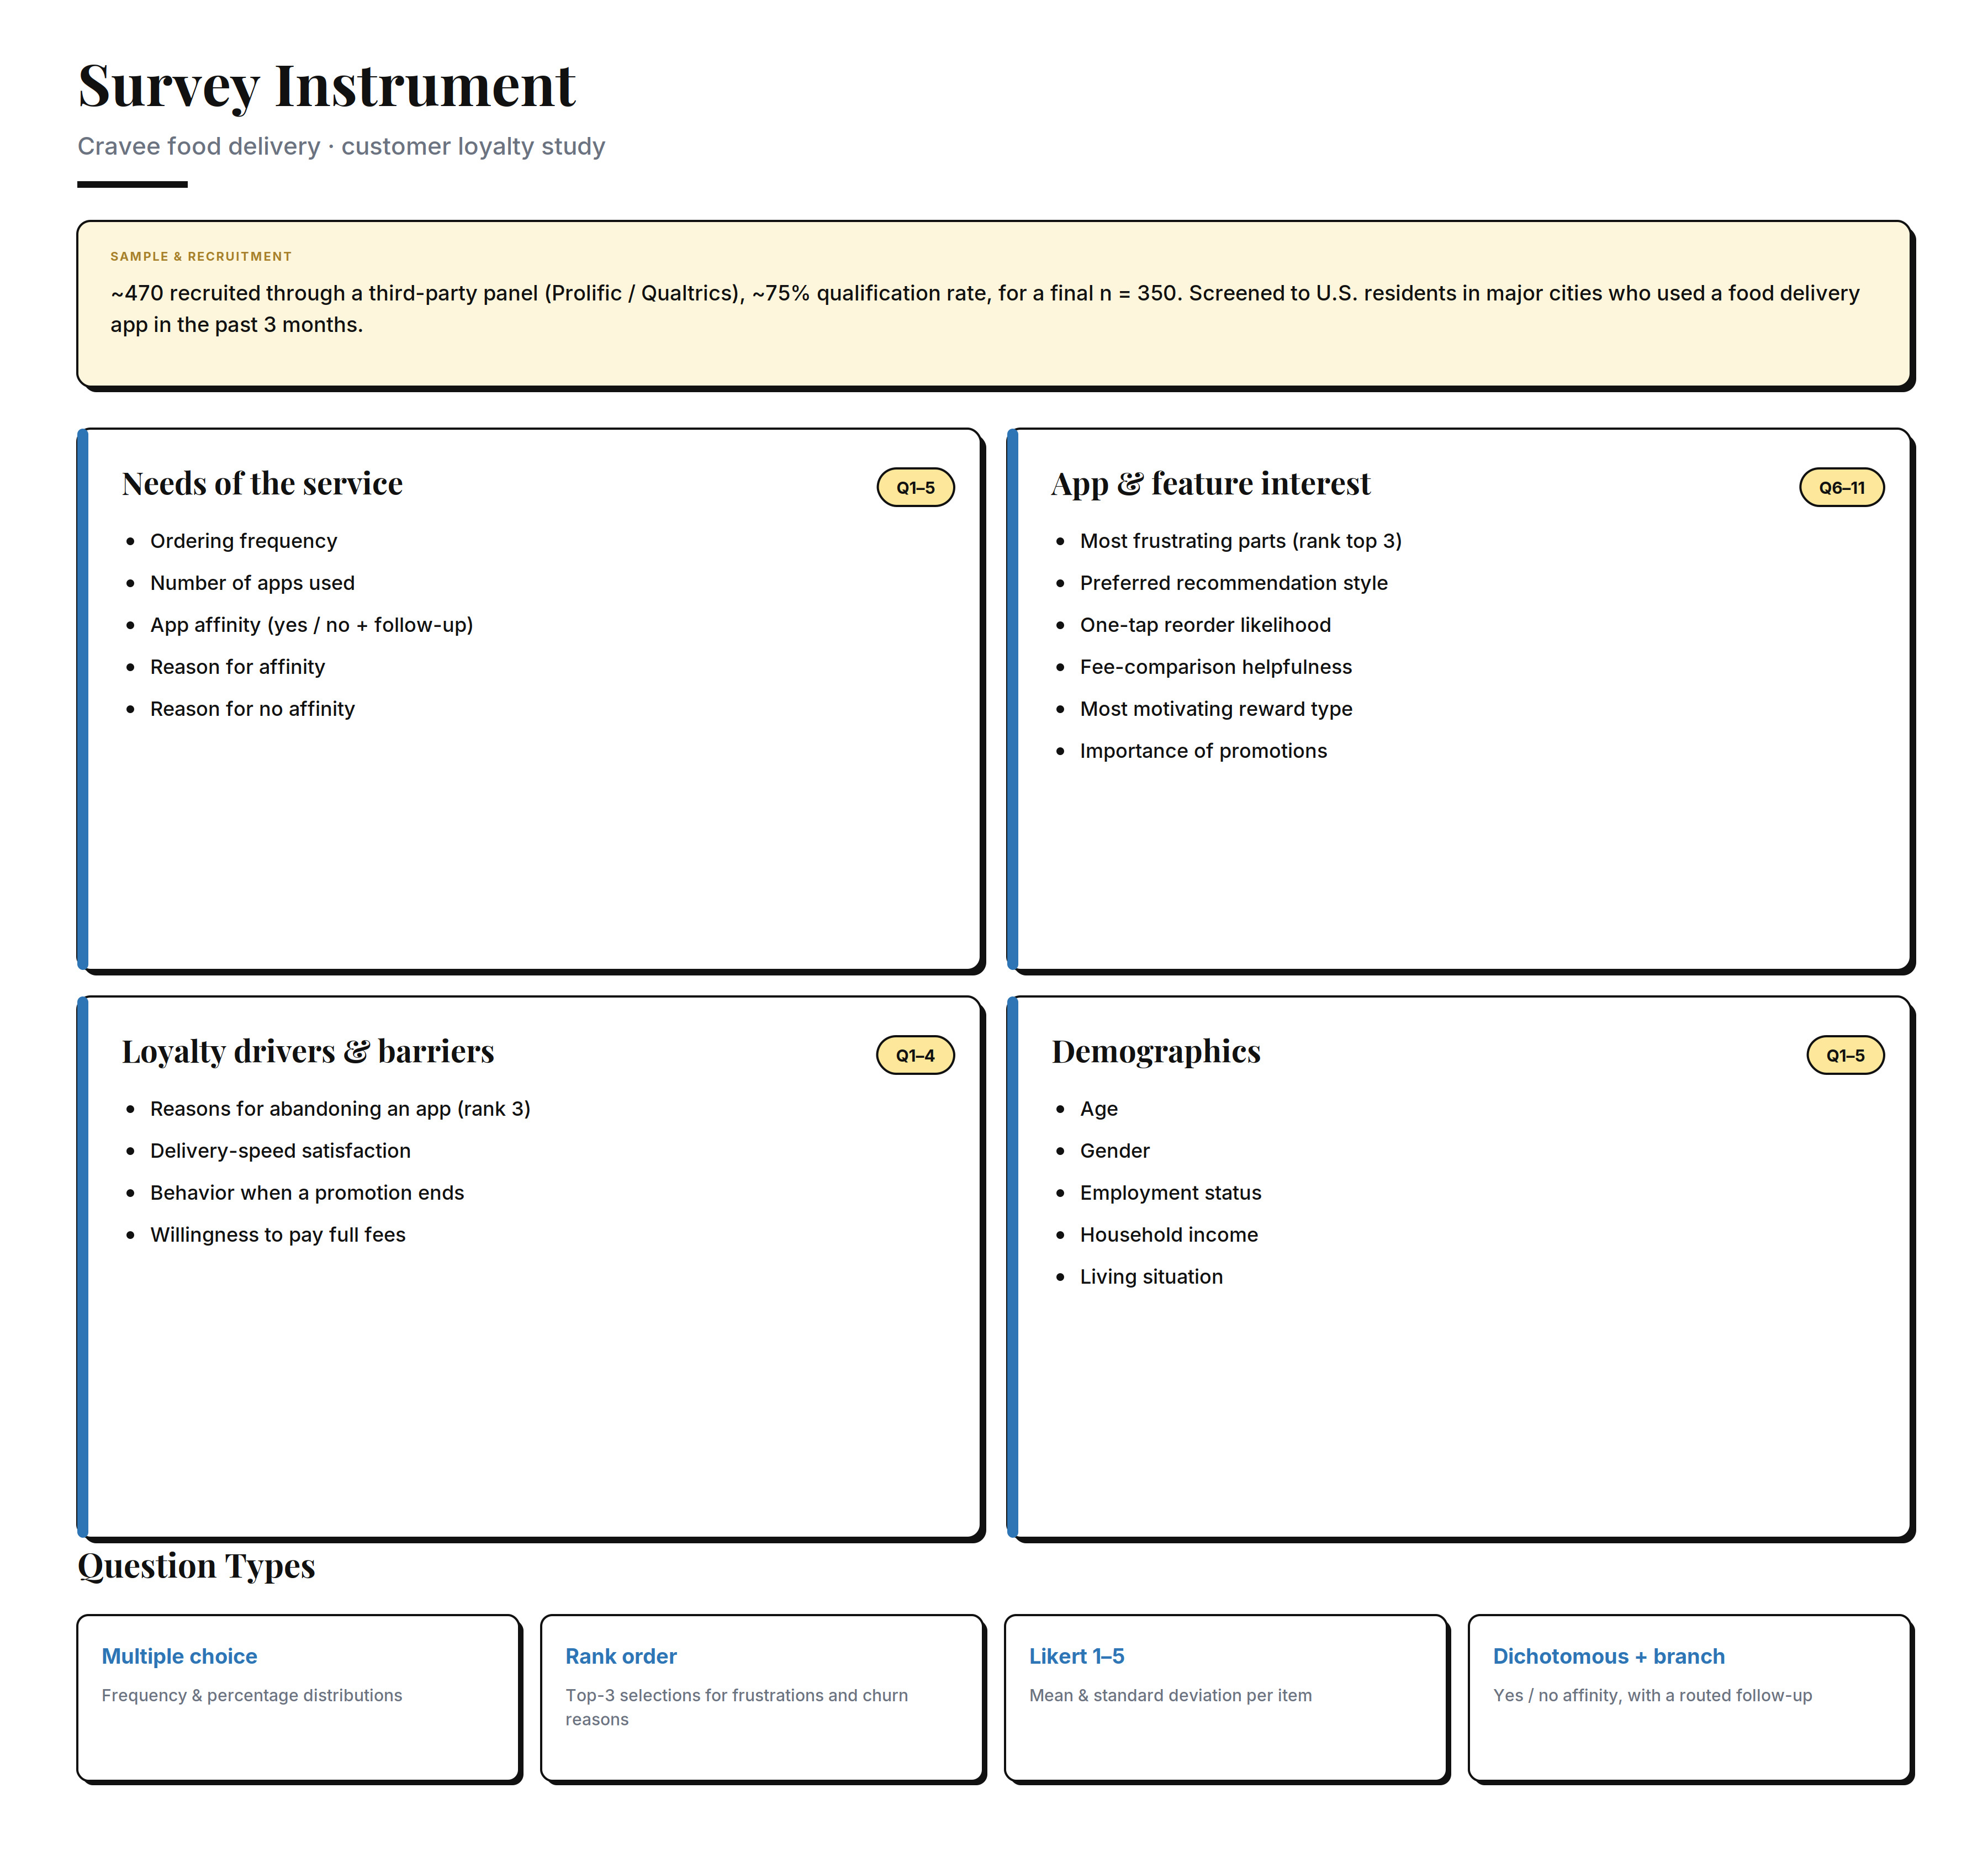
We surveyed 350 respondents. The pattern was clear: non-loyal users are rational shoppers, not disloyal by nature. Personalization was the lever that moved them.
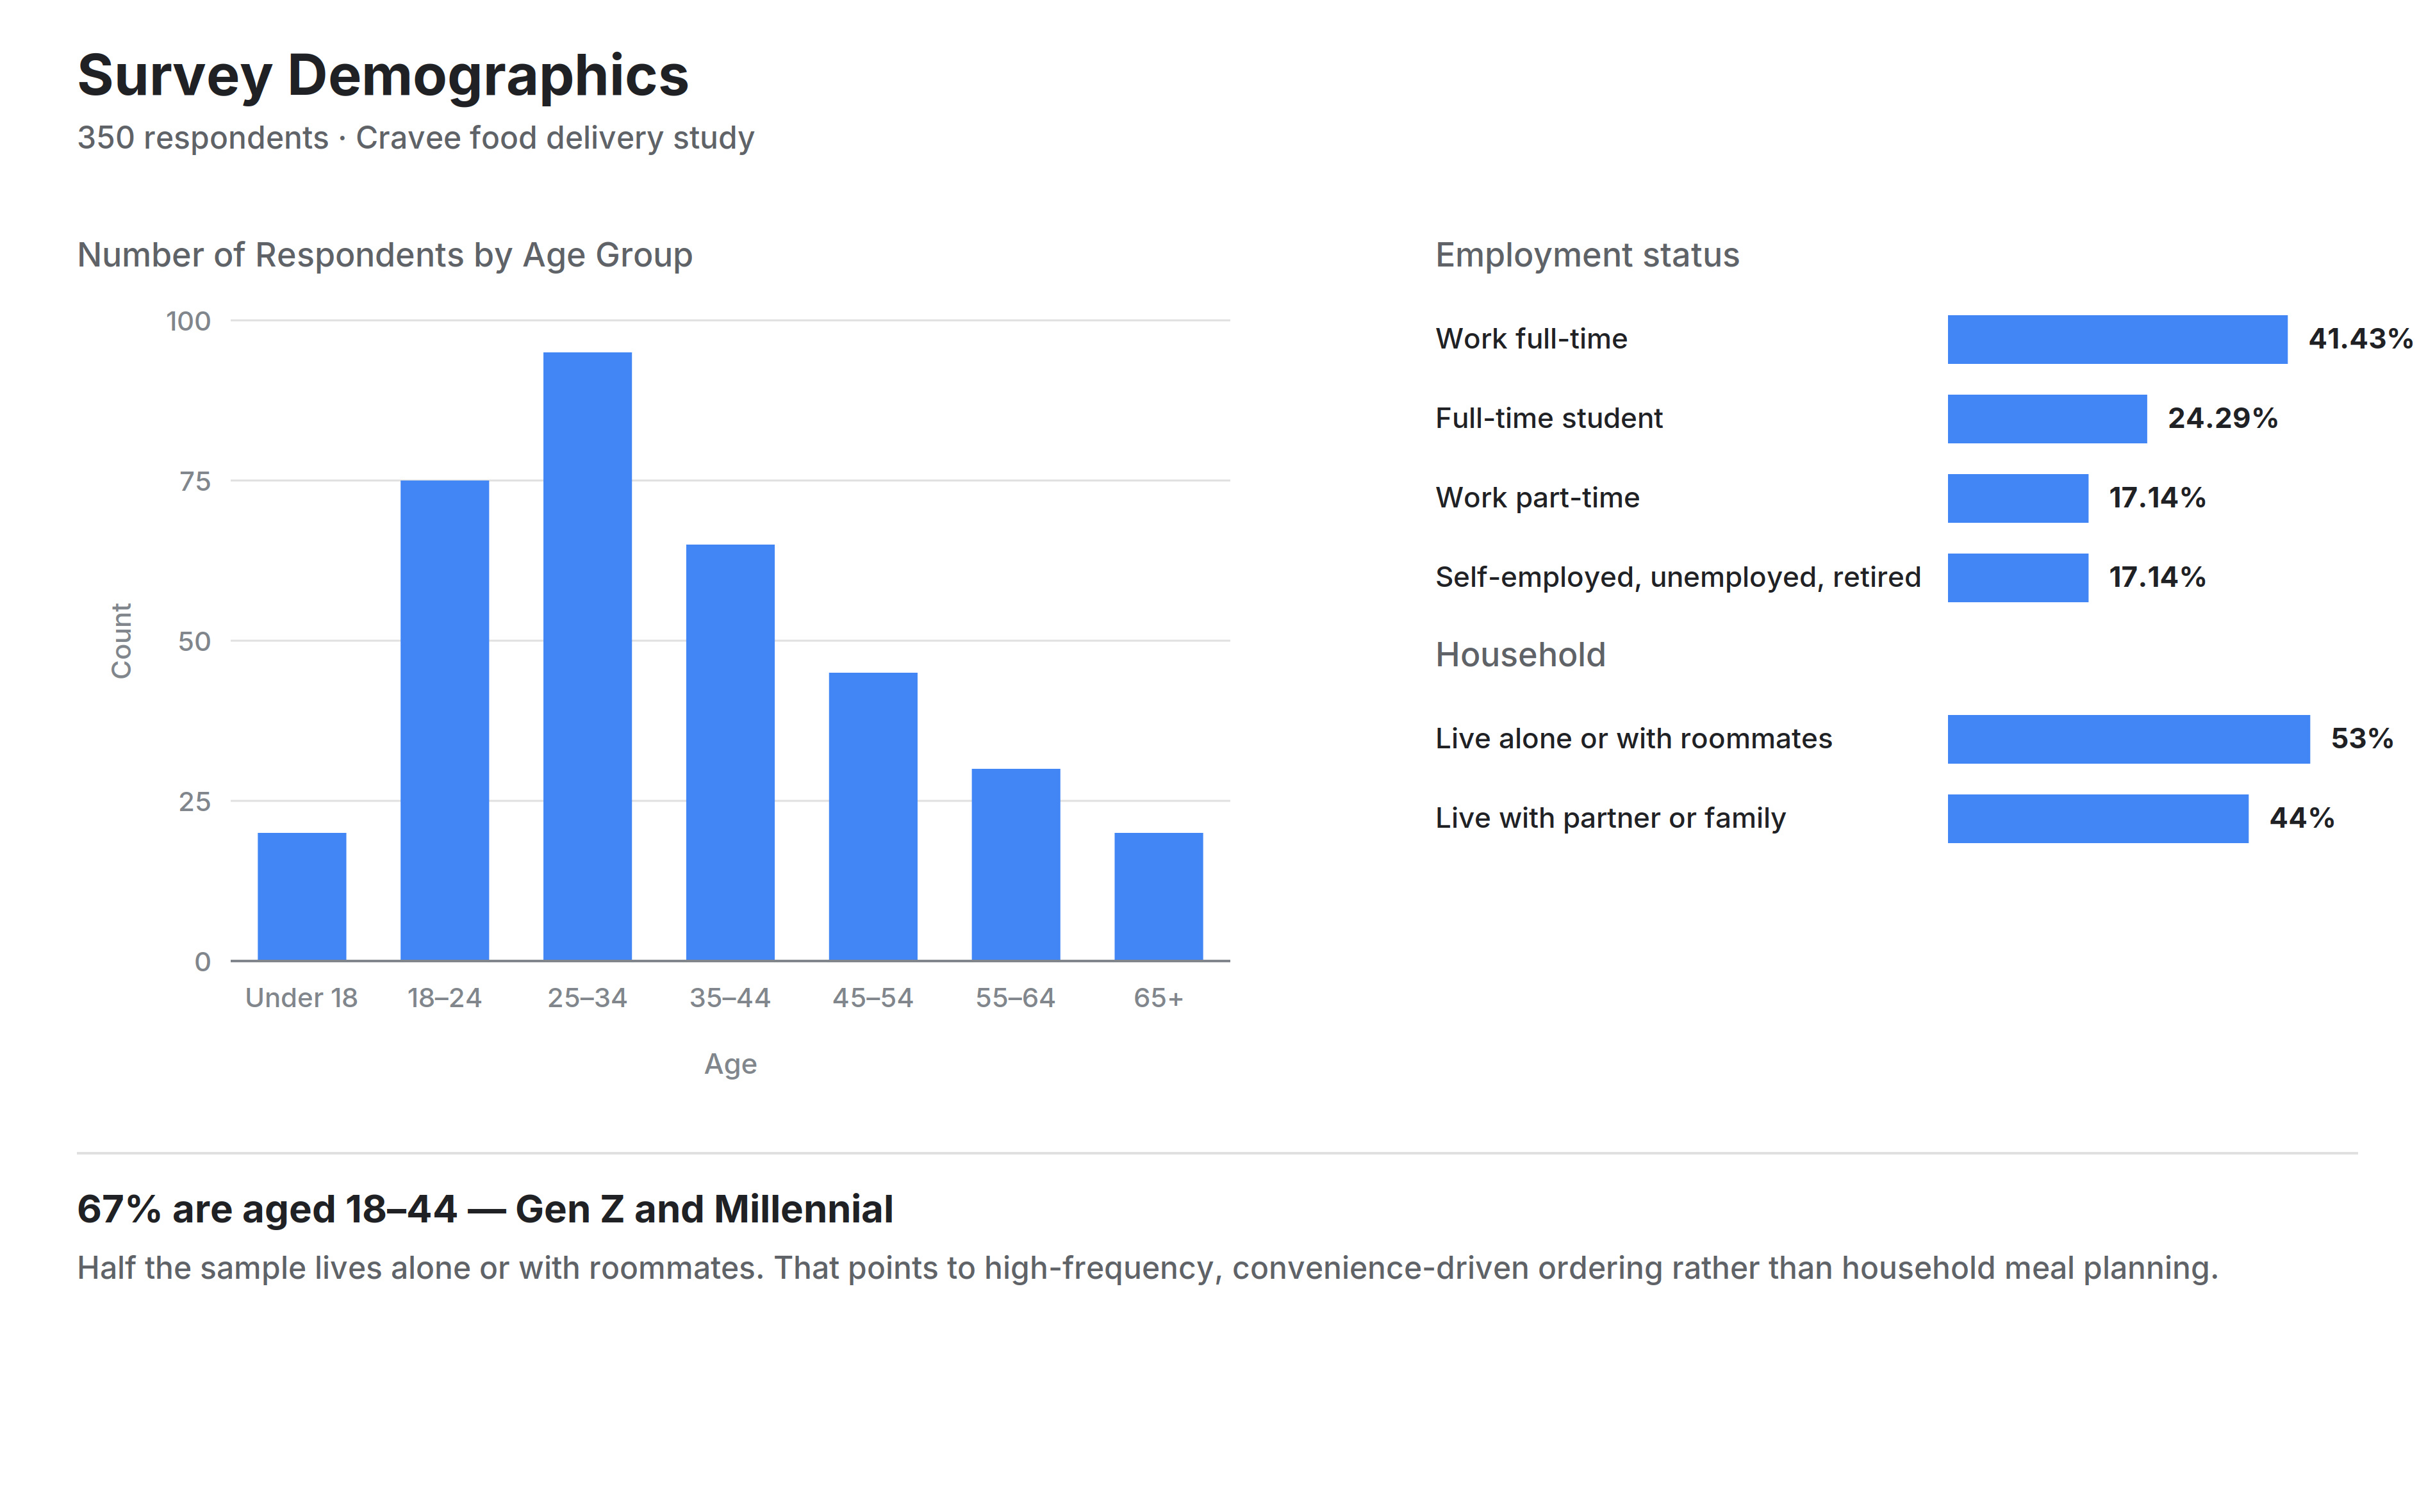
- Who they are: 67% identify as Gen Z or Millennial. 53% live alone or with roommates — high-frequency, convenience-driven ordering.
- How often they order: 83% order monthly.
- What they want: 31% prefer deal-based recommendations; 29% prefer past-order-based.
- The reorder signal: 76% would use a "tap to reorder" feature.
Critical Product Question
Can we design a retention intervention that creates lasting behavioral change — not just a temporary bump from discounts?
Phase 2: A/B Test Design
We tested one variable: whether the promotion was personalized. Everything else was held constant.
- Target audience: Users who ordered at least once a month for 3+ consecutive months, had not ordered in the past 2 months, but still opened the app at least once every 14 days.
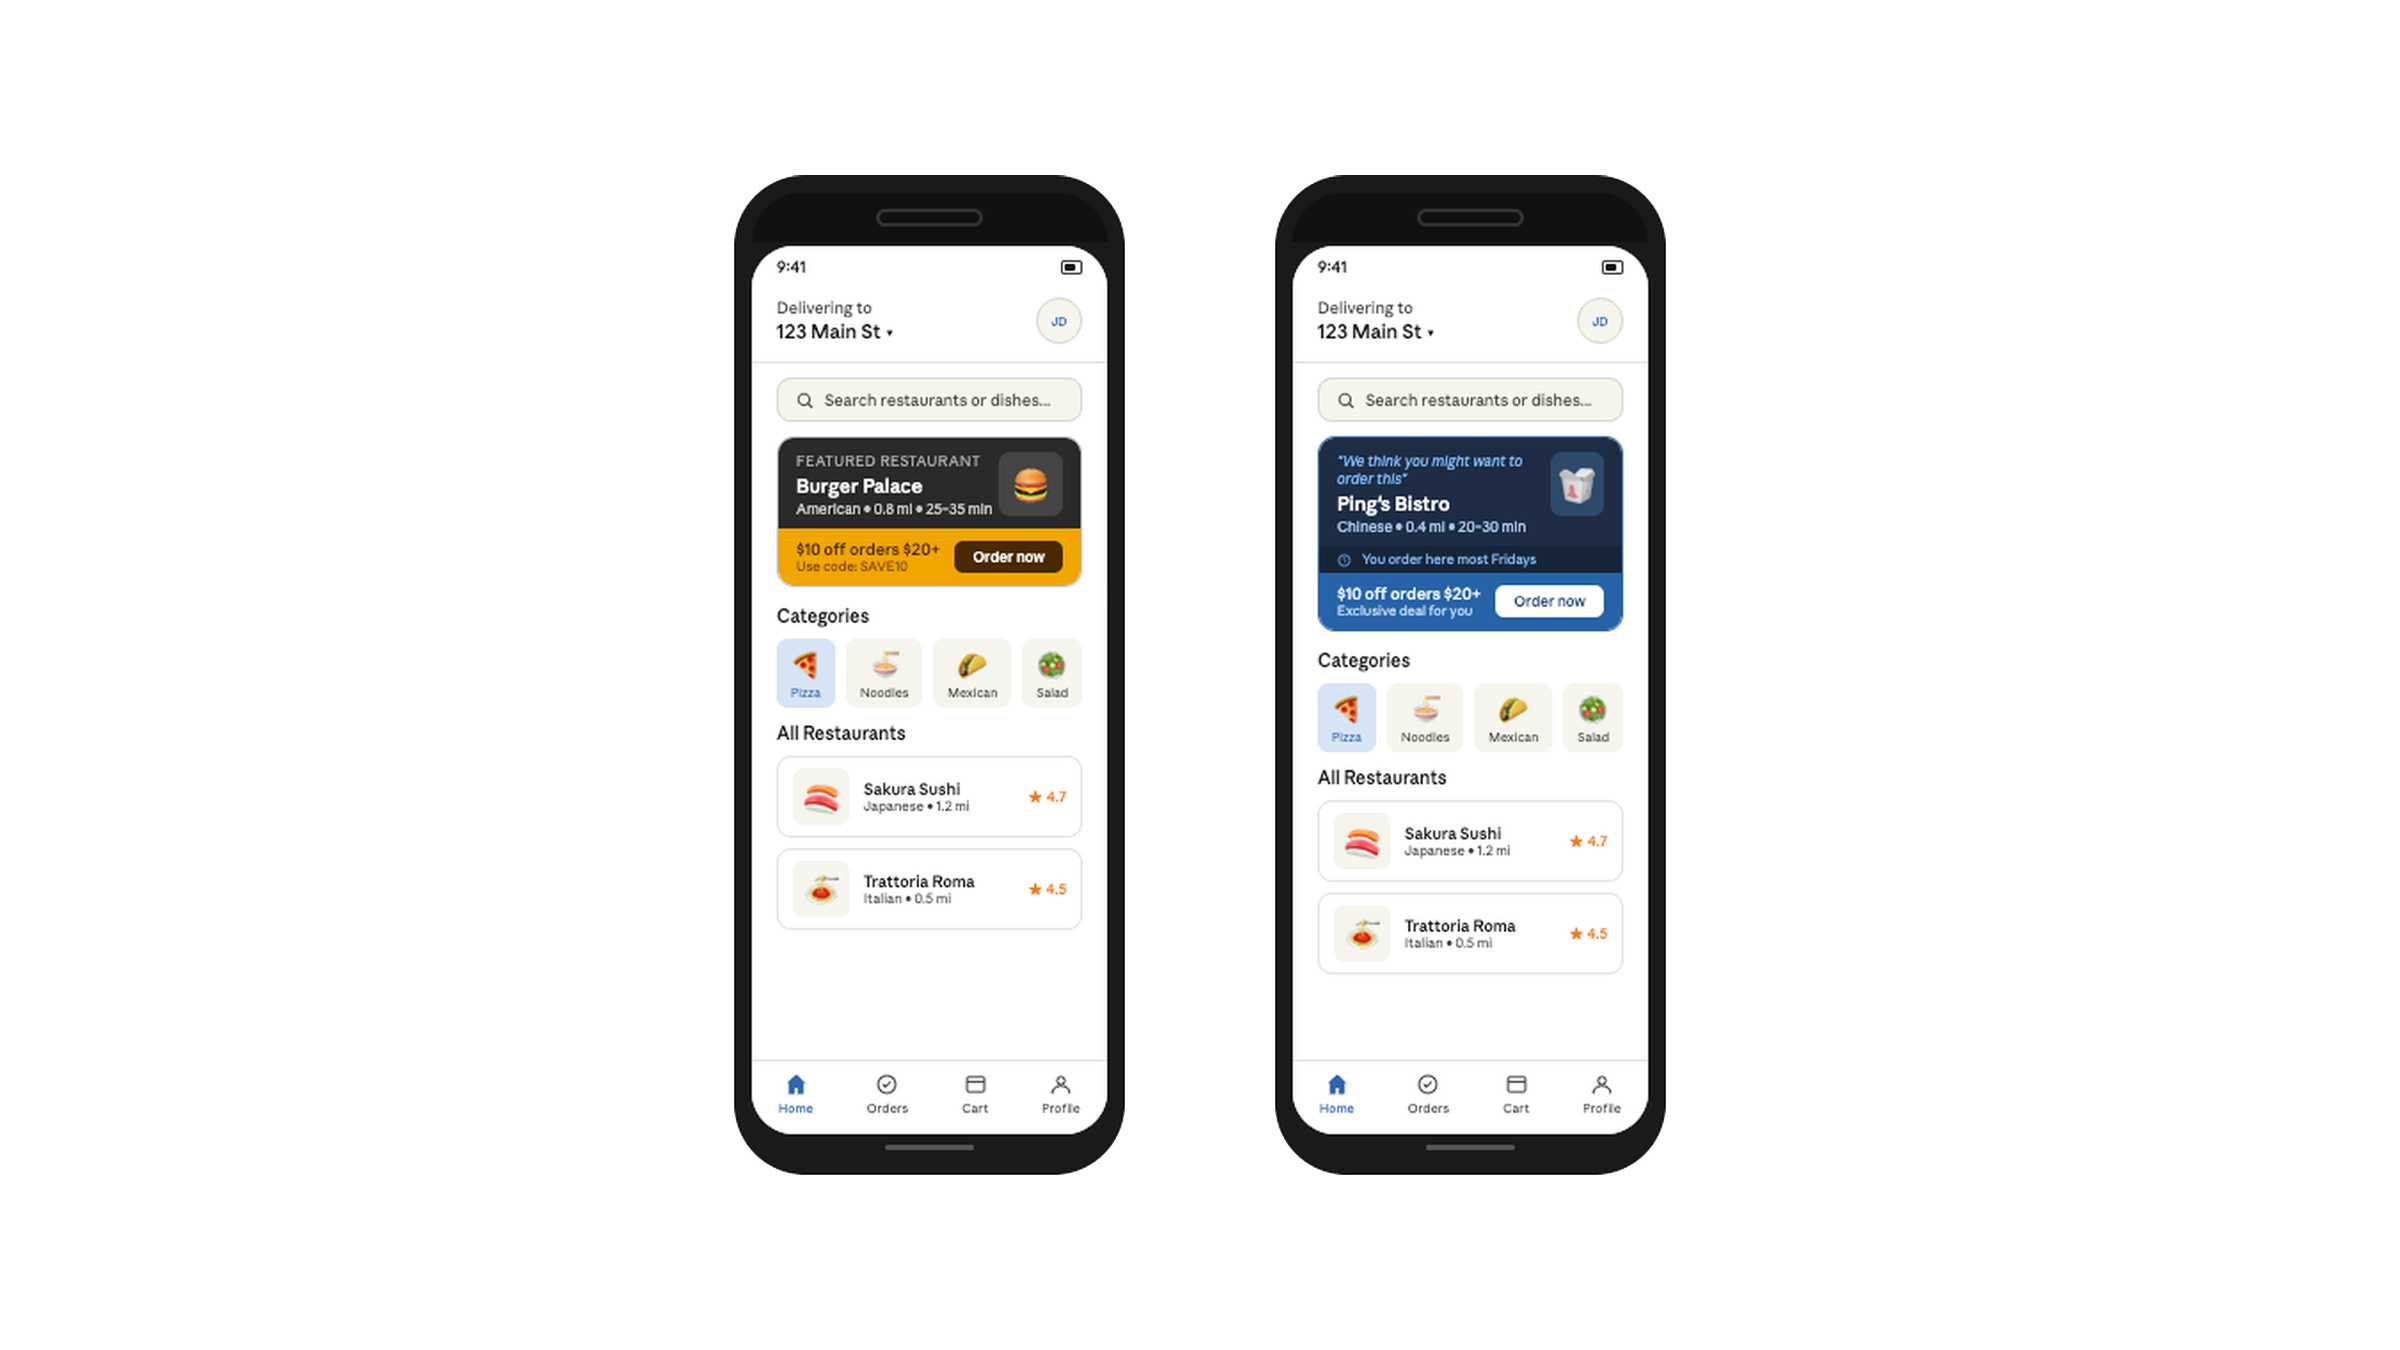
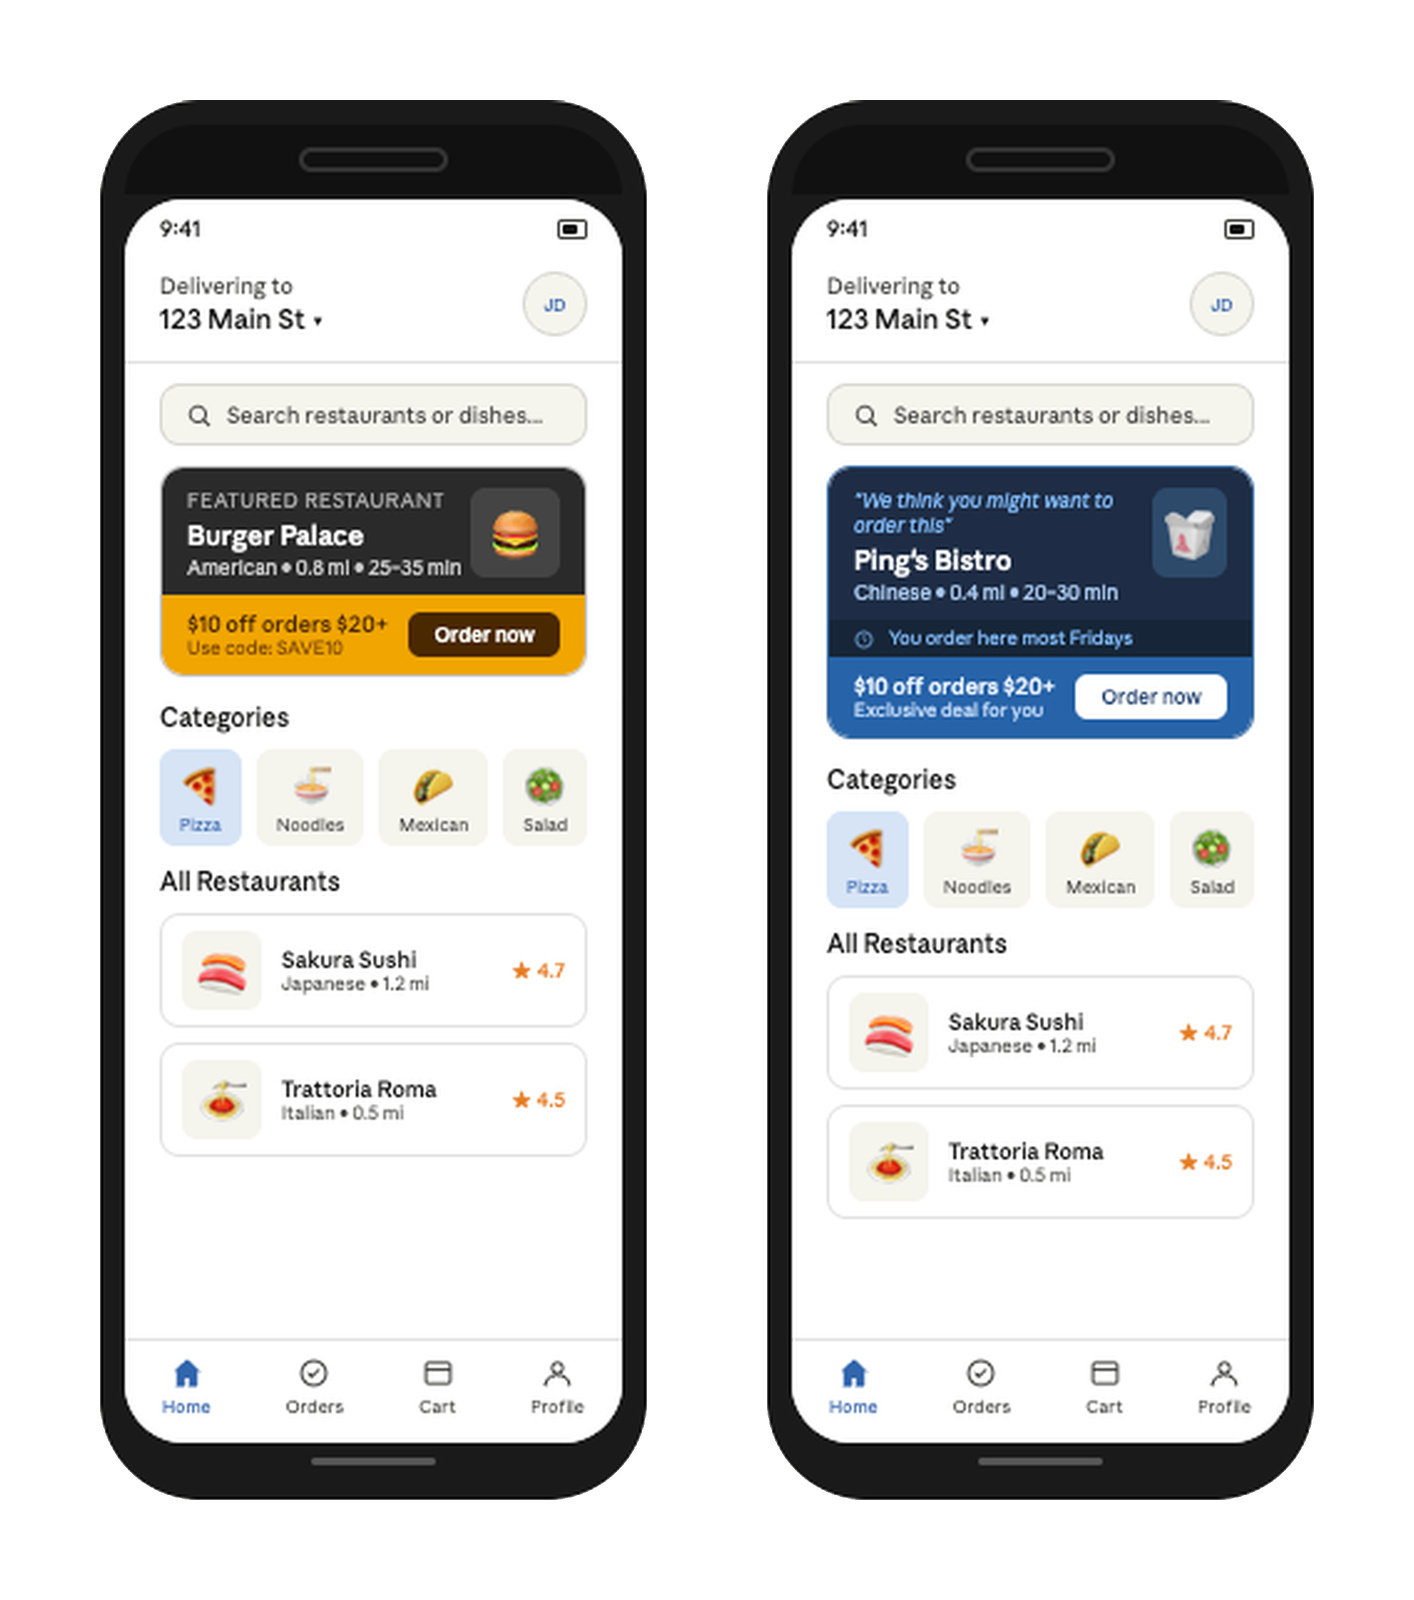
- Control group: A random restaurant promotion — "$10 off $20 order" at any restaurant.
- Treatment group: An AI-personalized promotion — "$10 off $20" at a restaurant tailored to their order history, with contextual cues like "You order here most Fridays."
- Design: 500 users per group, a 5-day activation window, and 90 days of behavior tracking.
Hypotheses & Results
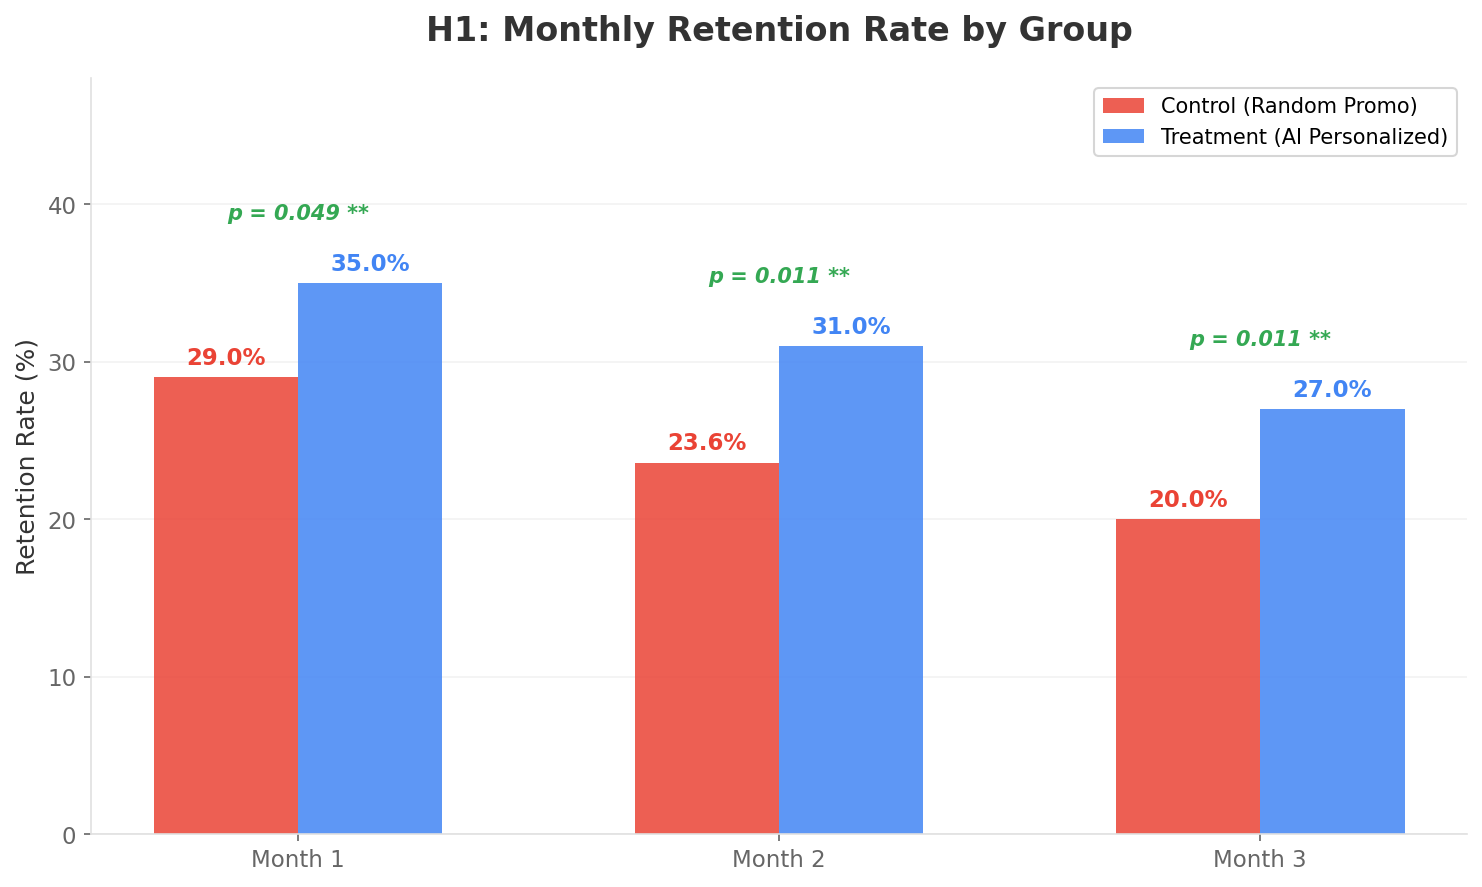
Monthly Retention Rate
Personalized promotions will produce a higher percentage of users placing at least one order per month.
Month 1: +21% (p=0.049) · Month 2: +31% (p=0.011) · Month 3: +35% (p=0.011). Effect grew stronger over time.
Repeat Purchase Rate
Among retained users, those receiving personalized promotions will place 2+ orders per month at a higher rate.
50–70% higher rates across all months, but p-values (0.083, 0.056, 0.138) did not reach significance. Subsample of 100–175 too small. Recommendation: scale to 2,000+ users.
Order Frequency
Treatment group will have higher total orders over the 90-day observation period.
Control: 0.87 avg orders → Treatment: 1.27 avg orders. +45% lift (t=3.60, p<0.001, Cohen's d=0.23). Every individual month also significant (all p<0.003).
Outcome
Before
29%
Monthly retention
0.87
Orders per 90 days
Generic
Random promotions for all
After
35.1%
Monthly retention — a 21% relative lift
1.27
Orders per 90 days (+45%)
AI-personalized
Tailored to behavior patterns
Reflection
The most instructive moment was H2. The repeat purchase rate showed a 50–70% lift — a large effect — but it didn't reach statistical significance. That taught me the difference between "no effect" and "insufficient power to detect an effect." Recommending we scale the test mattered as much as the confirmed findings. It kept the team from prematurely dismissing a promising signal. Translating stats into business language matters as much as the analysis. "p < 0.001" means nothing to most stakeholders. "For every 100 lapsed users we reach, personalization brings back 7 more than random promotions, and they keep ordering" — that drives decisions.
Thanks for reading!